A new site, built from published sources. Spotted a mistake? Please tell us

"Diagram showing rise and fall in numbers relieved": numbers on famine relief in the Nizam's Dominions, November 1899 to December 1900 (Report on the Famine Relief Operations ... 1309 Fasli (1899-1900), Vol. I, 1901)
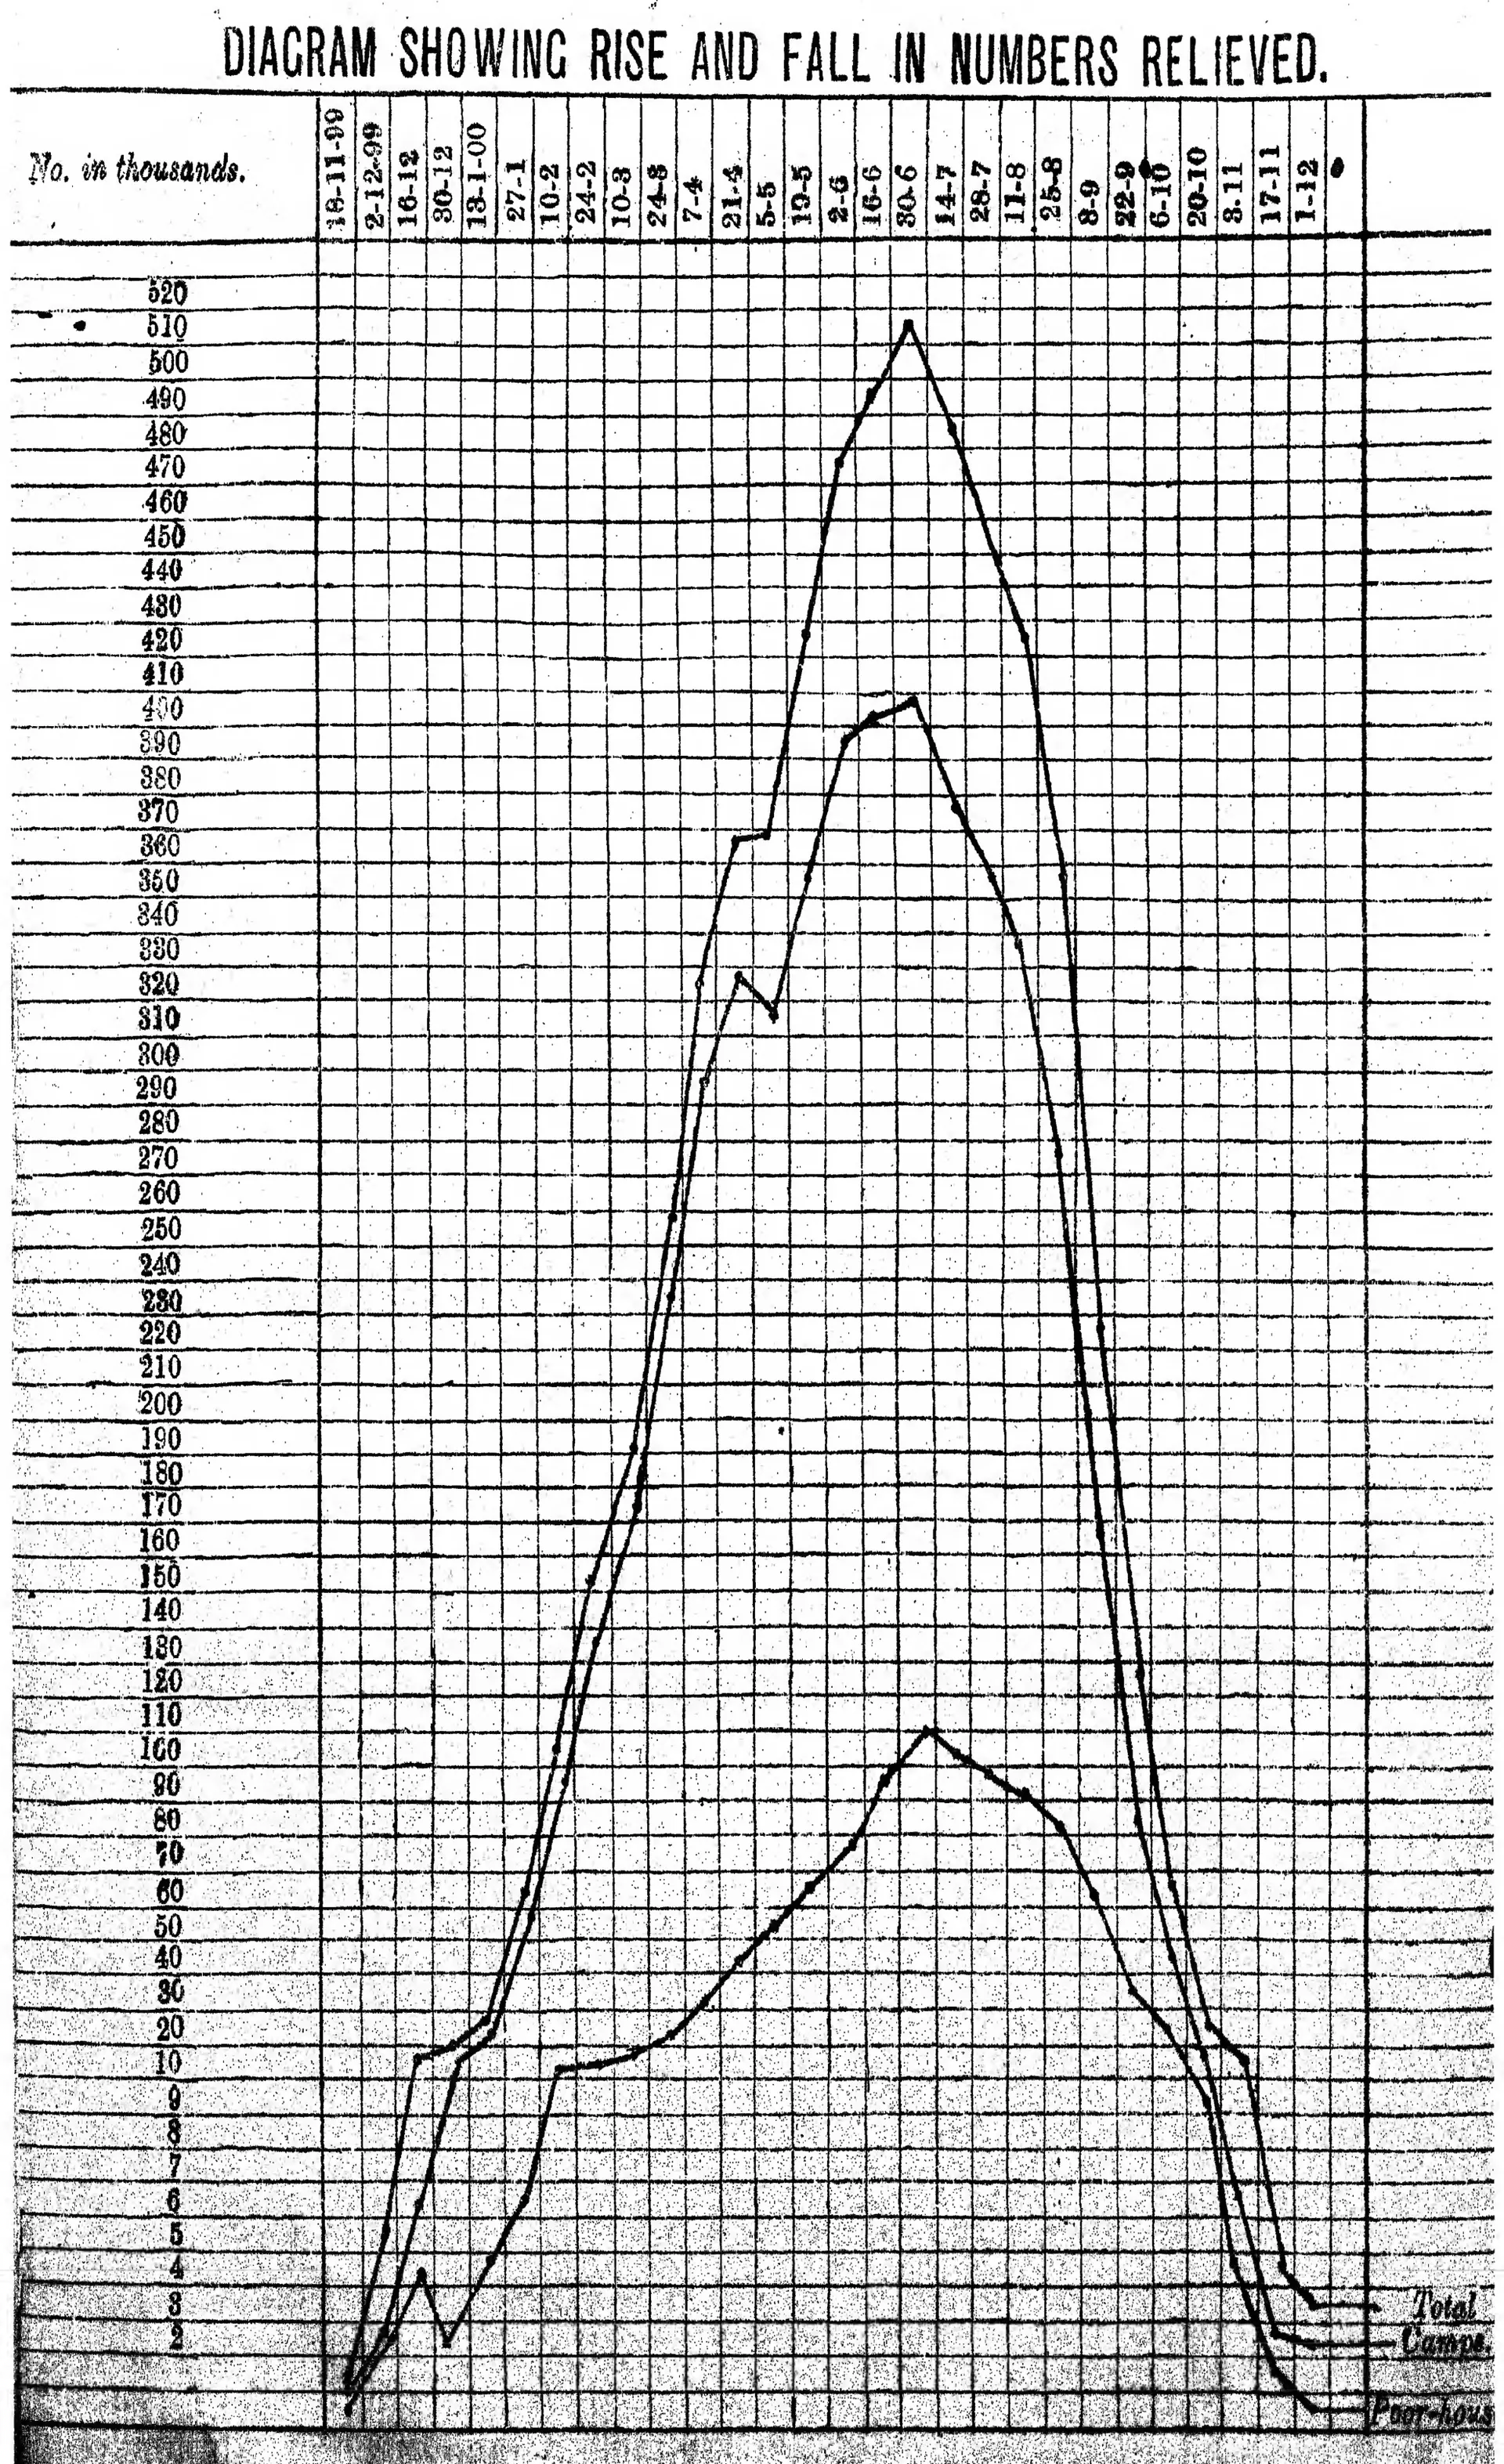
Printed line graph on squared paper with fortnightly dates from 18-11-99 to 1-12-00 across the top and numbers in thousands up the side; three curves for total, camps and poor-houses rise to a peak of about 510,000 at the end of June 1900 and fall away by December.
Type
Drawing
Creator
A. J. Dunlop, Famine Commissioner, Hyderabad (report)
Date
1901
Licence
Public domain
From
A. J. Dunlop, Report on the Famine Relief Operations in His Highness the Nizam's Dominions during 1309 Fasli (1899–1900), Vol. I (opens in a new tab), 1901, diagram (PDF p. 60)
Original
archive.org (opens in a new tab)
Appears in
Mughals, Asaf Jahis & the British, Asaf Jahis (Nizams of Hyderabad), Nalgonda, Government & administration